Reflector Analytics
This part of the report lists all of the defined emotions in rank order from most intensely rated to least intensely rated.
The ring of emotions is divided into quadrants and the quadrants are divided into zones, each zone covering emotions with similar functions. These zones are displayed as eight pairings of opposing states that form dimensions between the bright and the dark side of emotions. These dimensions function as a matter of more or less of each zone, rather than either/or. The emotional direction you are currently taking depends on the strength of each force you feel relative to the opposing zone.
The average rating for the emotions in each zone is calculated. For each pair, the smaller rating is subtracted from the bigger rating to give a single score. This is represented by a point on the dimension and is an indicator of your current weighting between the two zones.
Get Your Bearings
- On your chart change each dot to an arrow to show which direction you are currently moving on each dimension.
- What do you think each dimension is about?
- What is happening to place you where you are on each dimension?
- What are the positive emotions that are lifting you up? What is their source?
- What are the negative emotion(s) that are pulling you down? What is their source?
- How can you experience more of the positive emotion that would override this negative emotion?
This table may help you to think about the answer to some of these questions.
| Dimensions | The Self-Worth Values |
|---|---|
| thrilled ↔ useless | Fulfilment |
| chuffed ↔ sheepish | Status |
| gutsy ↔ wobbly | Risk taking |
| driven ↔ flat | Power |
| included ↔ mean | Security |
| caring ↔ grudging | Kindness |
| gracious ↔ spoilt | Gratitude |
| patient ↔ annoyed | Acceptance |
What is the Advanced Reflector?
The Reflector tool invites you to consider the feelings you currently have in a context of your choice, or your life in general. It invites you to use rating scales to capture how often and how strongly you feel each of forty carefully selected and defined emotions. You are also asked whether your current experience of each emotion feels good or feels bad. Responses are collated and displayed in a chart.
The Reflector has been designed for insight and discussion. It is not a psychometric instrument. You are completing it for yourself. You will get the most out of it if you can discuss it with a colleague or friend.
What is the Value of Emotional Reflection
- we can recognise discrete emotions rather than a mix of emotions or general feelings
- our emotions provide richer information and deeper meaning
- we can identify the causes of our emotions and so make a sensible response
- we can experience difficult emotions with more perspective and less toxicity
- we can evaluate what difficult emotions are telling us to do rather than dwell on why we feel so badly.
What does my chart mean?

The Reflector is designed to allow you to consider your emotions within the Ring of Preferences, outlined in Knowing and Growing (Mclean 2017). The ring formed by our ‘feel good preferences’ provides an objective and non-judgemental framework to consider your emotions and their impact on your wellbeing.
The ER provides the following measures
- Your Feel Good Score as defined by you. It is the percentage of your 'feel good' selections measured against the possible 100%.
- Wellbeing is a measure of what the theory says is good for you and is given by the percentage of your total ratings of your ratings in top half of the ring (emotion scores in the lower half of the ring detract from this percentage score).
- Your percentage share of each of the quadrants
- Your average rating for the emotions in each quadrant
- Your emotions within each of the quadrants are listed in rank order
These measures are provided to help your thinking. You are not comparing yourself to others or a norm or a standard. This is not a profile of you as a person, but rather a snapshot of the emotions passing through at one particular time/context.
The frequency and intensity ratings for each emotion are multiplied together to create a score on a twenty-five-point scale.
| 0 | 1 | 2 | 3 | 4 | 5 | 6 | 8 | 9 | 10 | 12 | 15 | 16 | 20 | 25 |
| never, or no feeling | hardly ever and very mild | s/times and very mild, or mild and hardly ever | often and very mild, or strong but hardly ever | most of time but very mild, or very strong but hardly ever, or s/times mild | intense but hardly ever, or all the time but mild | s/times strong, or often but mild | mild most of time or s/times very strong | often strong | s/times intense, or mild all the time | strong most of the time, or often and very strong | strong all the time, or often intense | very strong most of the time | always very strong or intense most of time | intense all the time |
| never, or no feeling | 0 |
| hardly ever and very mild | 1 |
| s/times and very mild, or mild and hardly ever | 2 |
| often and very mild, or strong but hardly ever | 3 |
| most of time but very mild, or very strong but hardly ever, or s/times mild | 4 |
| intense but hardly ever, or all the time but mild | 5 |
| s/times strong, or often but mild | 6 |
| mild most of time or s/times very strong | 8 |
| often strong | 9 |
| s/times intense, or mild all the time | 10 |
| strong most of the time, or often and very strong | 12 |
| strong all the time, or often intense | 15 |
| very strong most of the time | 16 |
| always very strong or intense most of time | 20 |
| intense all the time | 25 |
Follow up Questions
- Does the chart reflect how you are feeling?
- Does anything surprise you?
- What do your big feel good and feel bad emotions tell you?
- What triggers these emotions? What are they about?
- Thinking about your most troubling emotions - What do you tell yourself about these emotions?
- Would you say the same things to someone else who was having these feelings? Are there more useful messages to take from these emotions?
- Could any of your top feel good emotions be used to combat your most unwanted emotions?
- How have your emotions changed over time?
Using the Reflector with students
The Reflector, when completed by young people and shared with adults, will help adults better understand how students are feeling in school or college and so get to know them better. It facilitates a non-judgemental conversation between adults and young people about the emotions they experience that affect their wellbeing and learning.
When students have finished their ratings it will be helpful to invite them to quickly review their ratings to check they are what they intended?
What is the thinking behind the chart?
Emotions help us to evaluate what is happening to us. They signal our needs and how well we are meeting these needs. Emotions are closely linked to our motives because they drive us to meet our needs.
Autonomy, or self-direction, is our super-motive. However, self-direction is always in relation to others; we have to balance our own needs with the needs of others. This conundrum lies at the heart of human relationships. Unsurprisingly, most of our emotions are mainly about our self-direction in relation to our goals and other people.
The ring model illuminates two preferences, namely making our mark and being part of things. We are driven by both, to a greater or lesser extent although most of us will have a preference for one or the other. The preferences are represented as spirals. Each spiral has an optimal mid-point and two extremes, one showing too much of the given quality and the other too little.
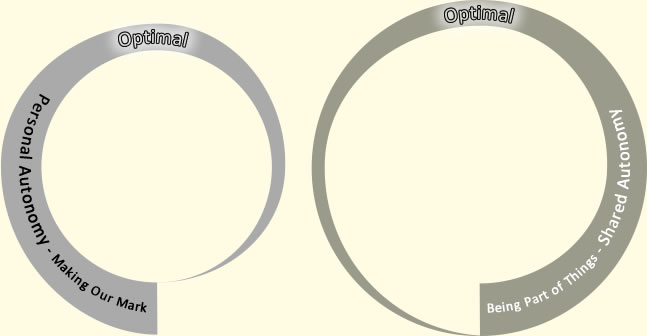
Figure 1 The Preferences
When put together the spirals form a ring. The upper half of the ring shows the spirals in balance, where the preferences are of similar weight. As we progress around the ring in either direction we can chart the increasing imbalance between the spirals. In the upper half the effect is bright and emotionally uplifting, below it spirals downwards into the dark side of the Ring.
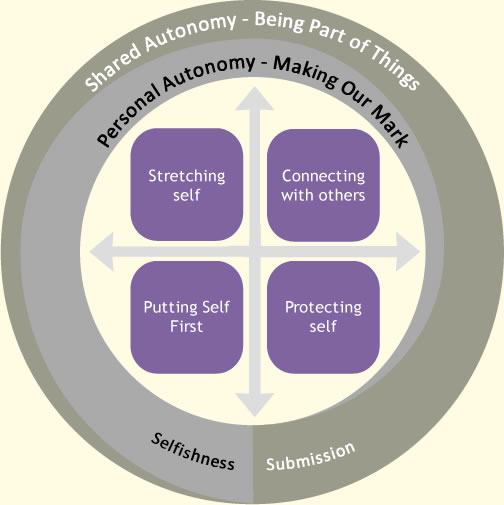
Figure 2 The Ring of Preferences and the Emotion Quadrants
The ring is divided into quadrants. The chart gives us a picture of our current emotional state. It is best used to discuss what is enriching us and what is potentially draining or distracting us. The model helps us to make sense of what's happening to us and how we can best respond. It can aid us to better understand the purpose of each emotion and how emotions can get us into trouble as well as help us. It can also help us discover our own emotional recipe for our wellbeing.
You can collate a number of individual profiles to discover:
- the overall positivity of a group
- the most commonly experienced emotions within a group
Please contact us to discuss how you can purchase the Assembly programme that enables this.